Publication | Analytical framework to evaluate and optimize the use of imperfect diagnostics to inform outbreak response: Application to the 2017 plague epidemic in Madagascar

This publication is part of the project ‘Preparing for vector-borne virus outbreaks in a changing world: a One Health Approach’ (NWA.1160.1S.210) which is (partly) financed by the Dutch Research Council (NWO).

Abstract
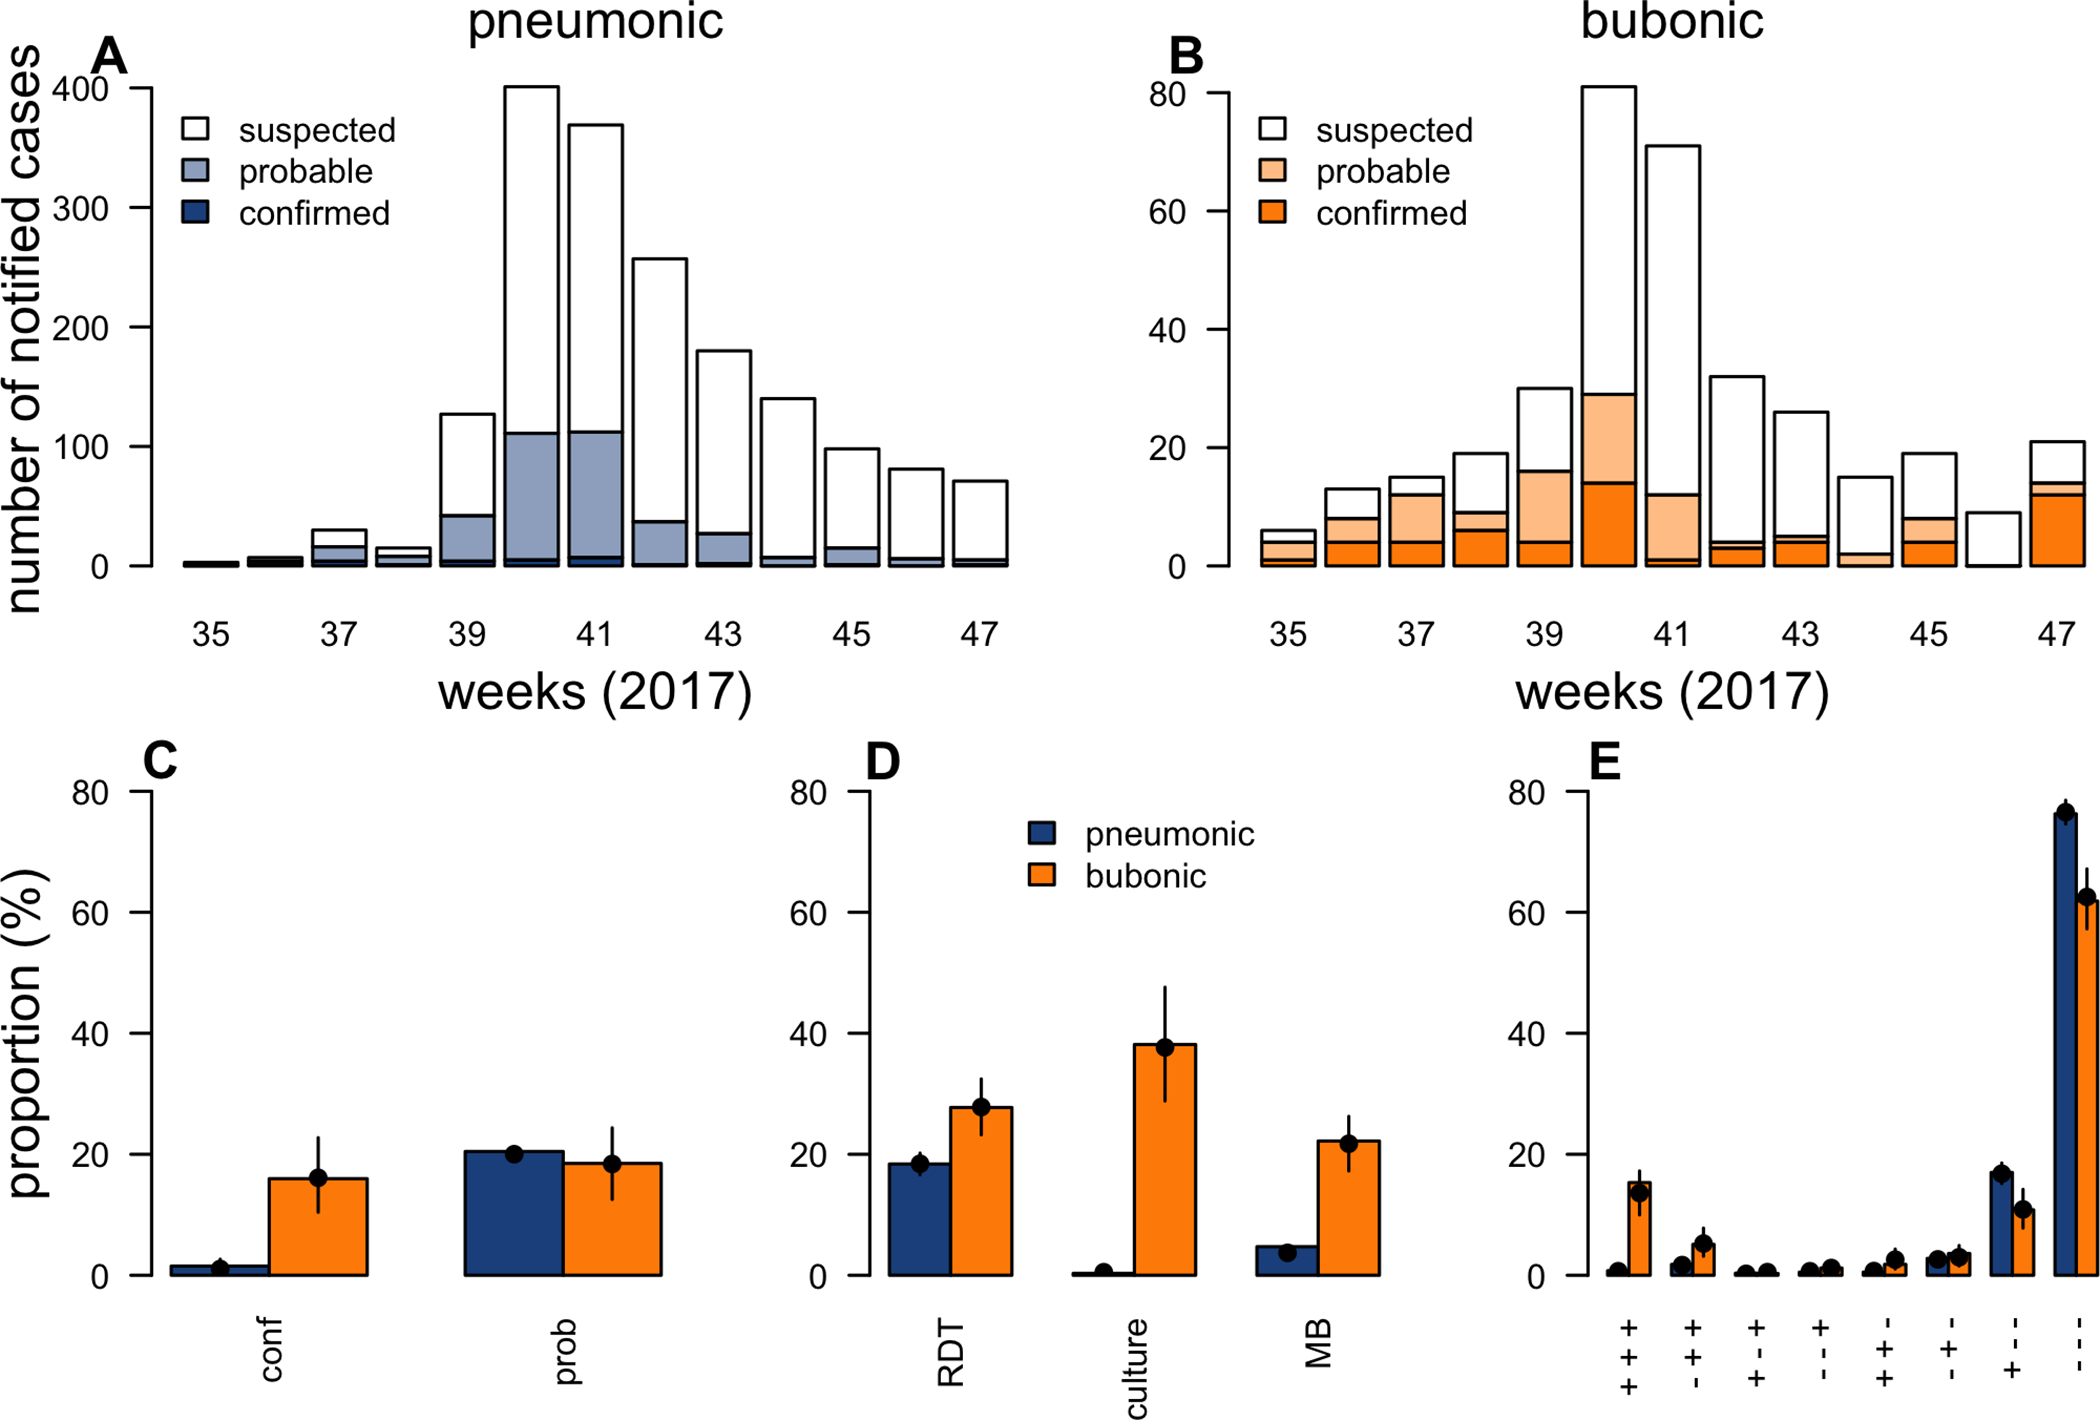
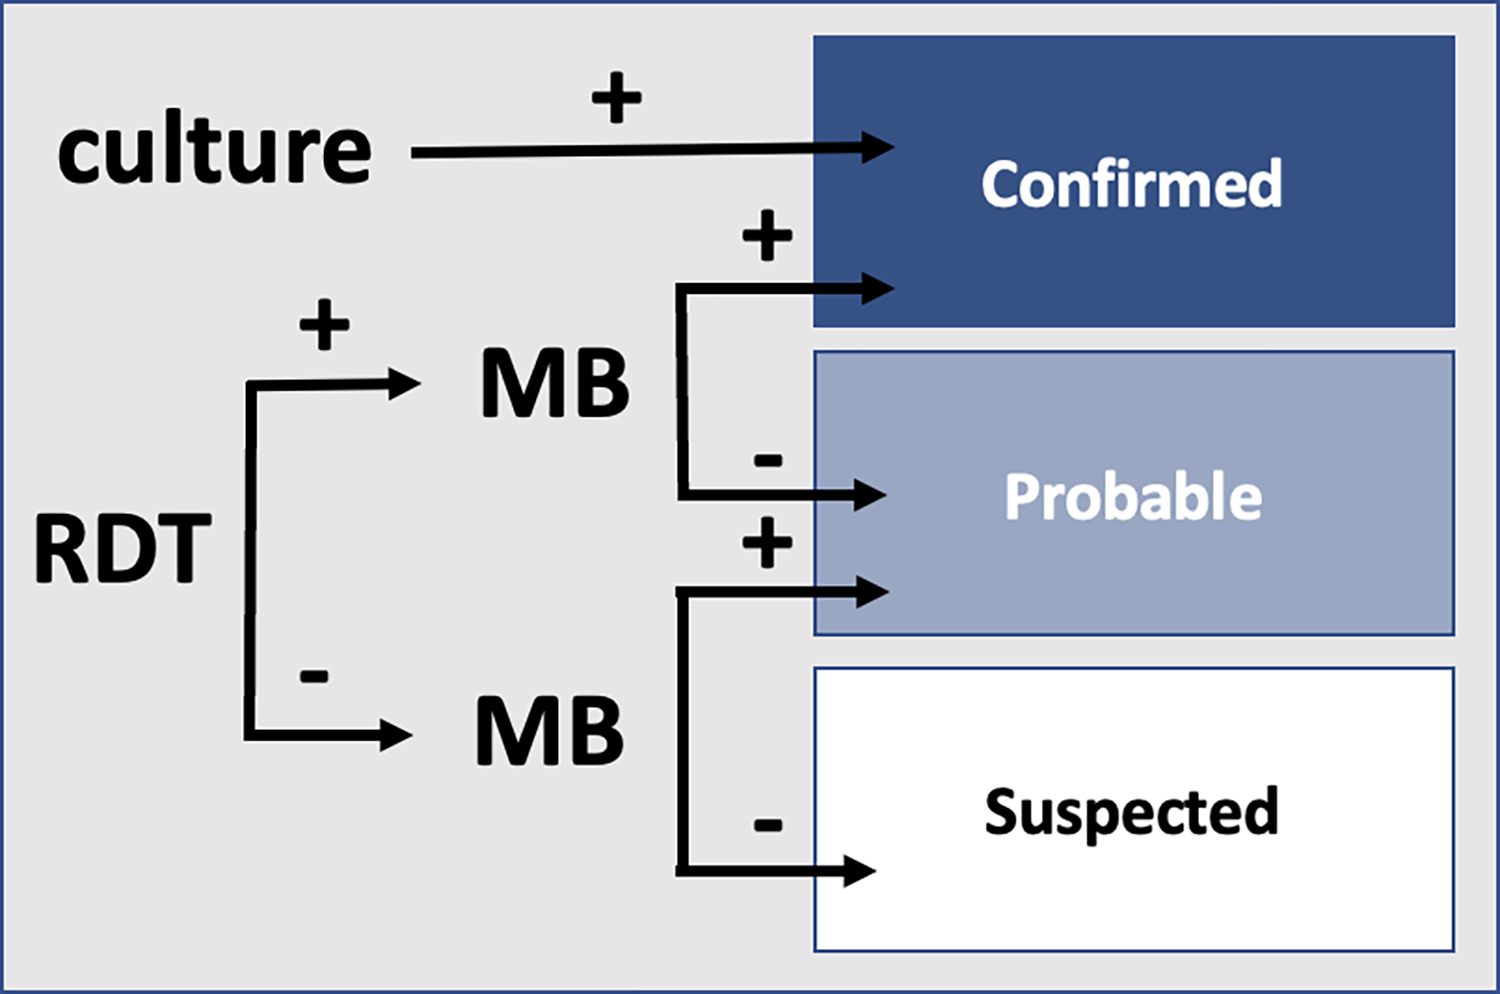
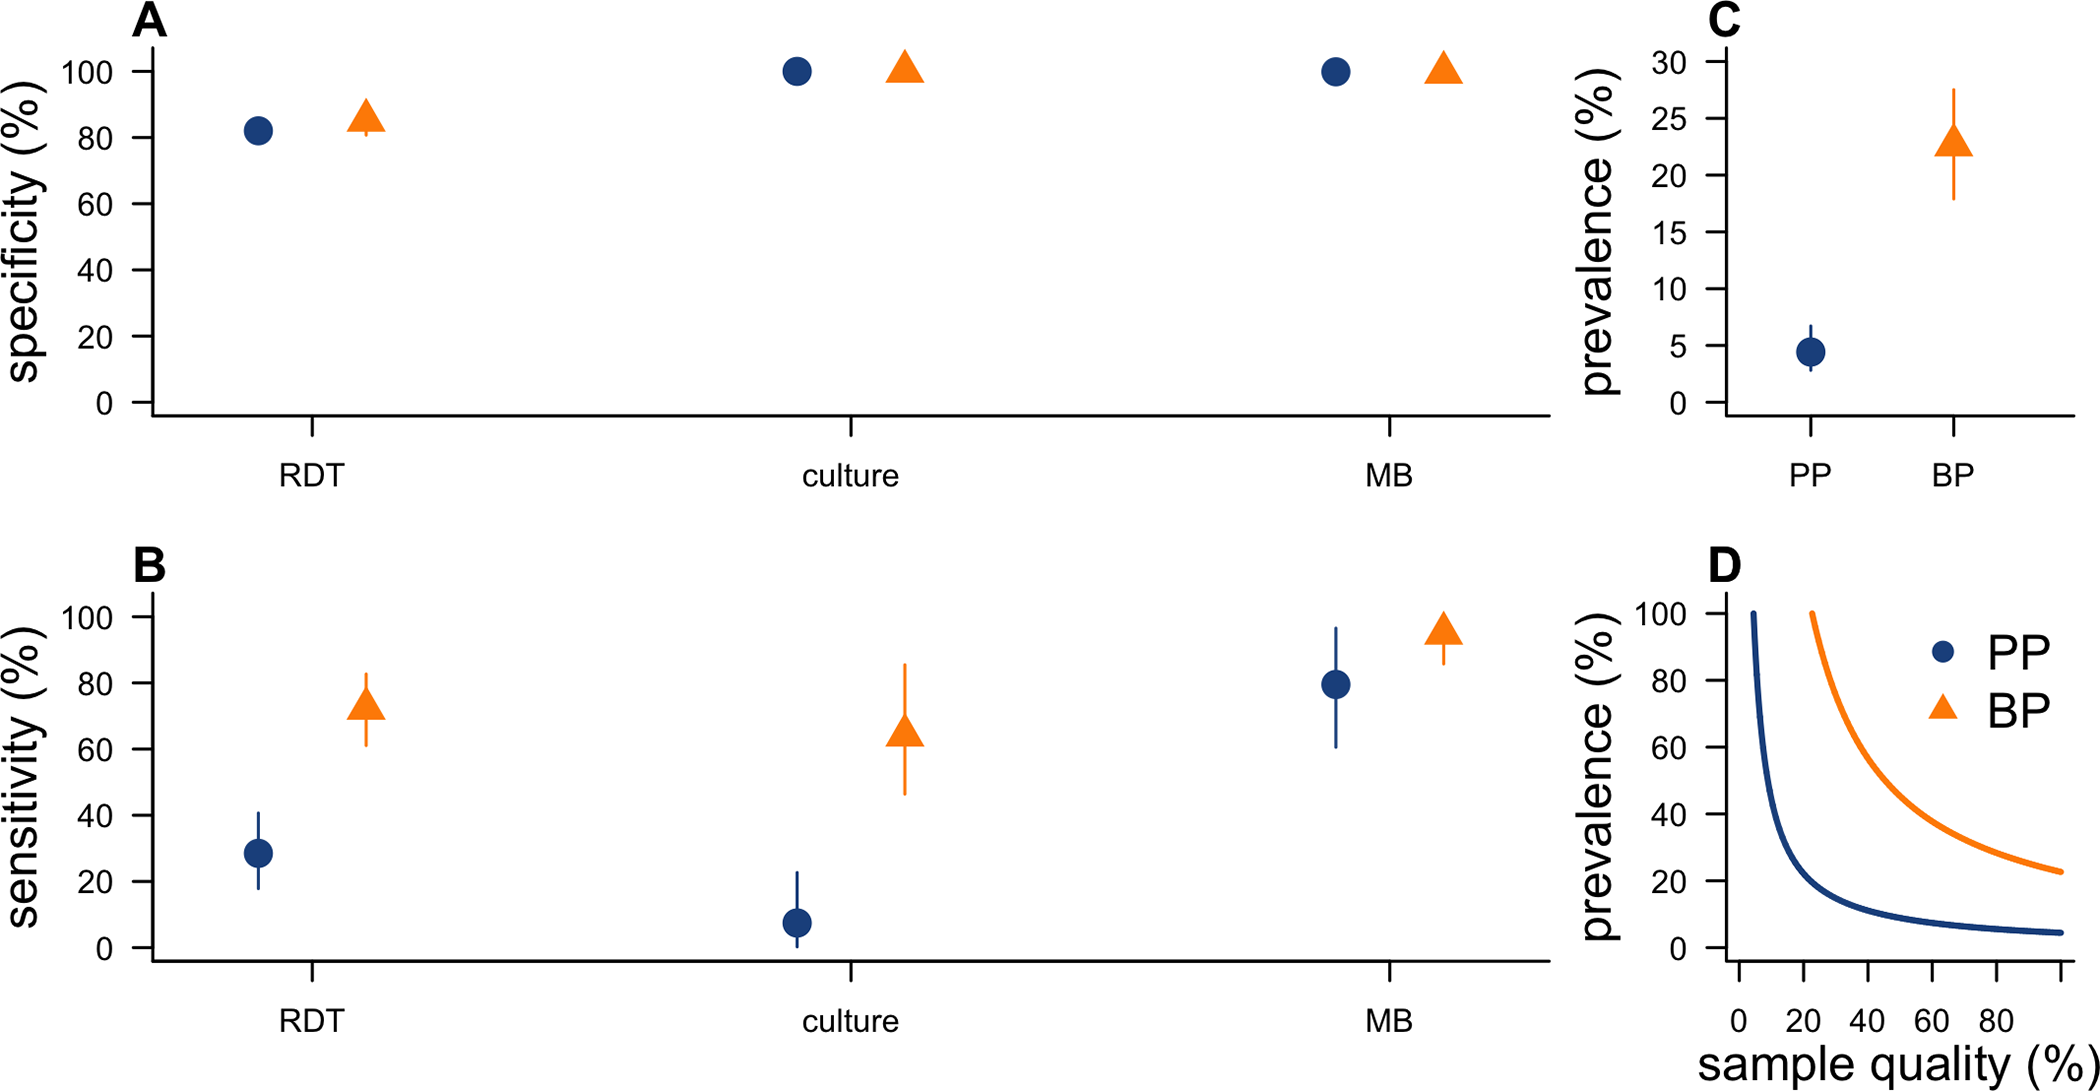
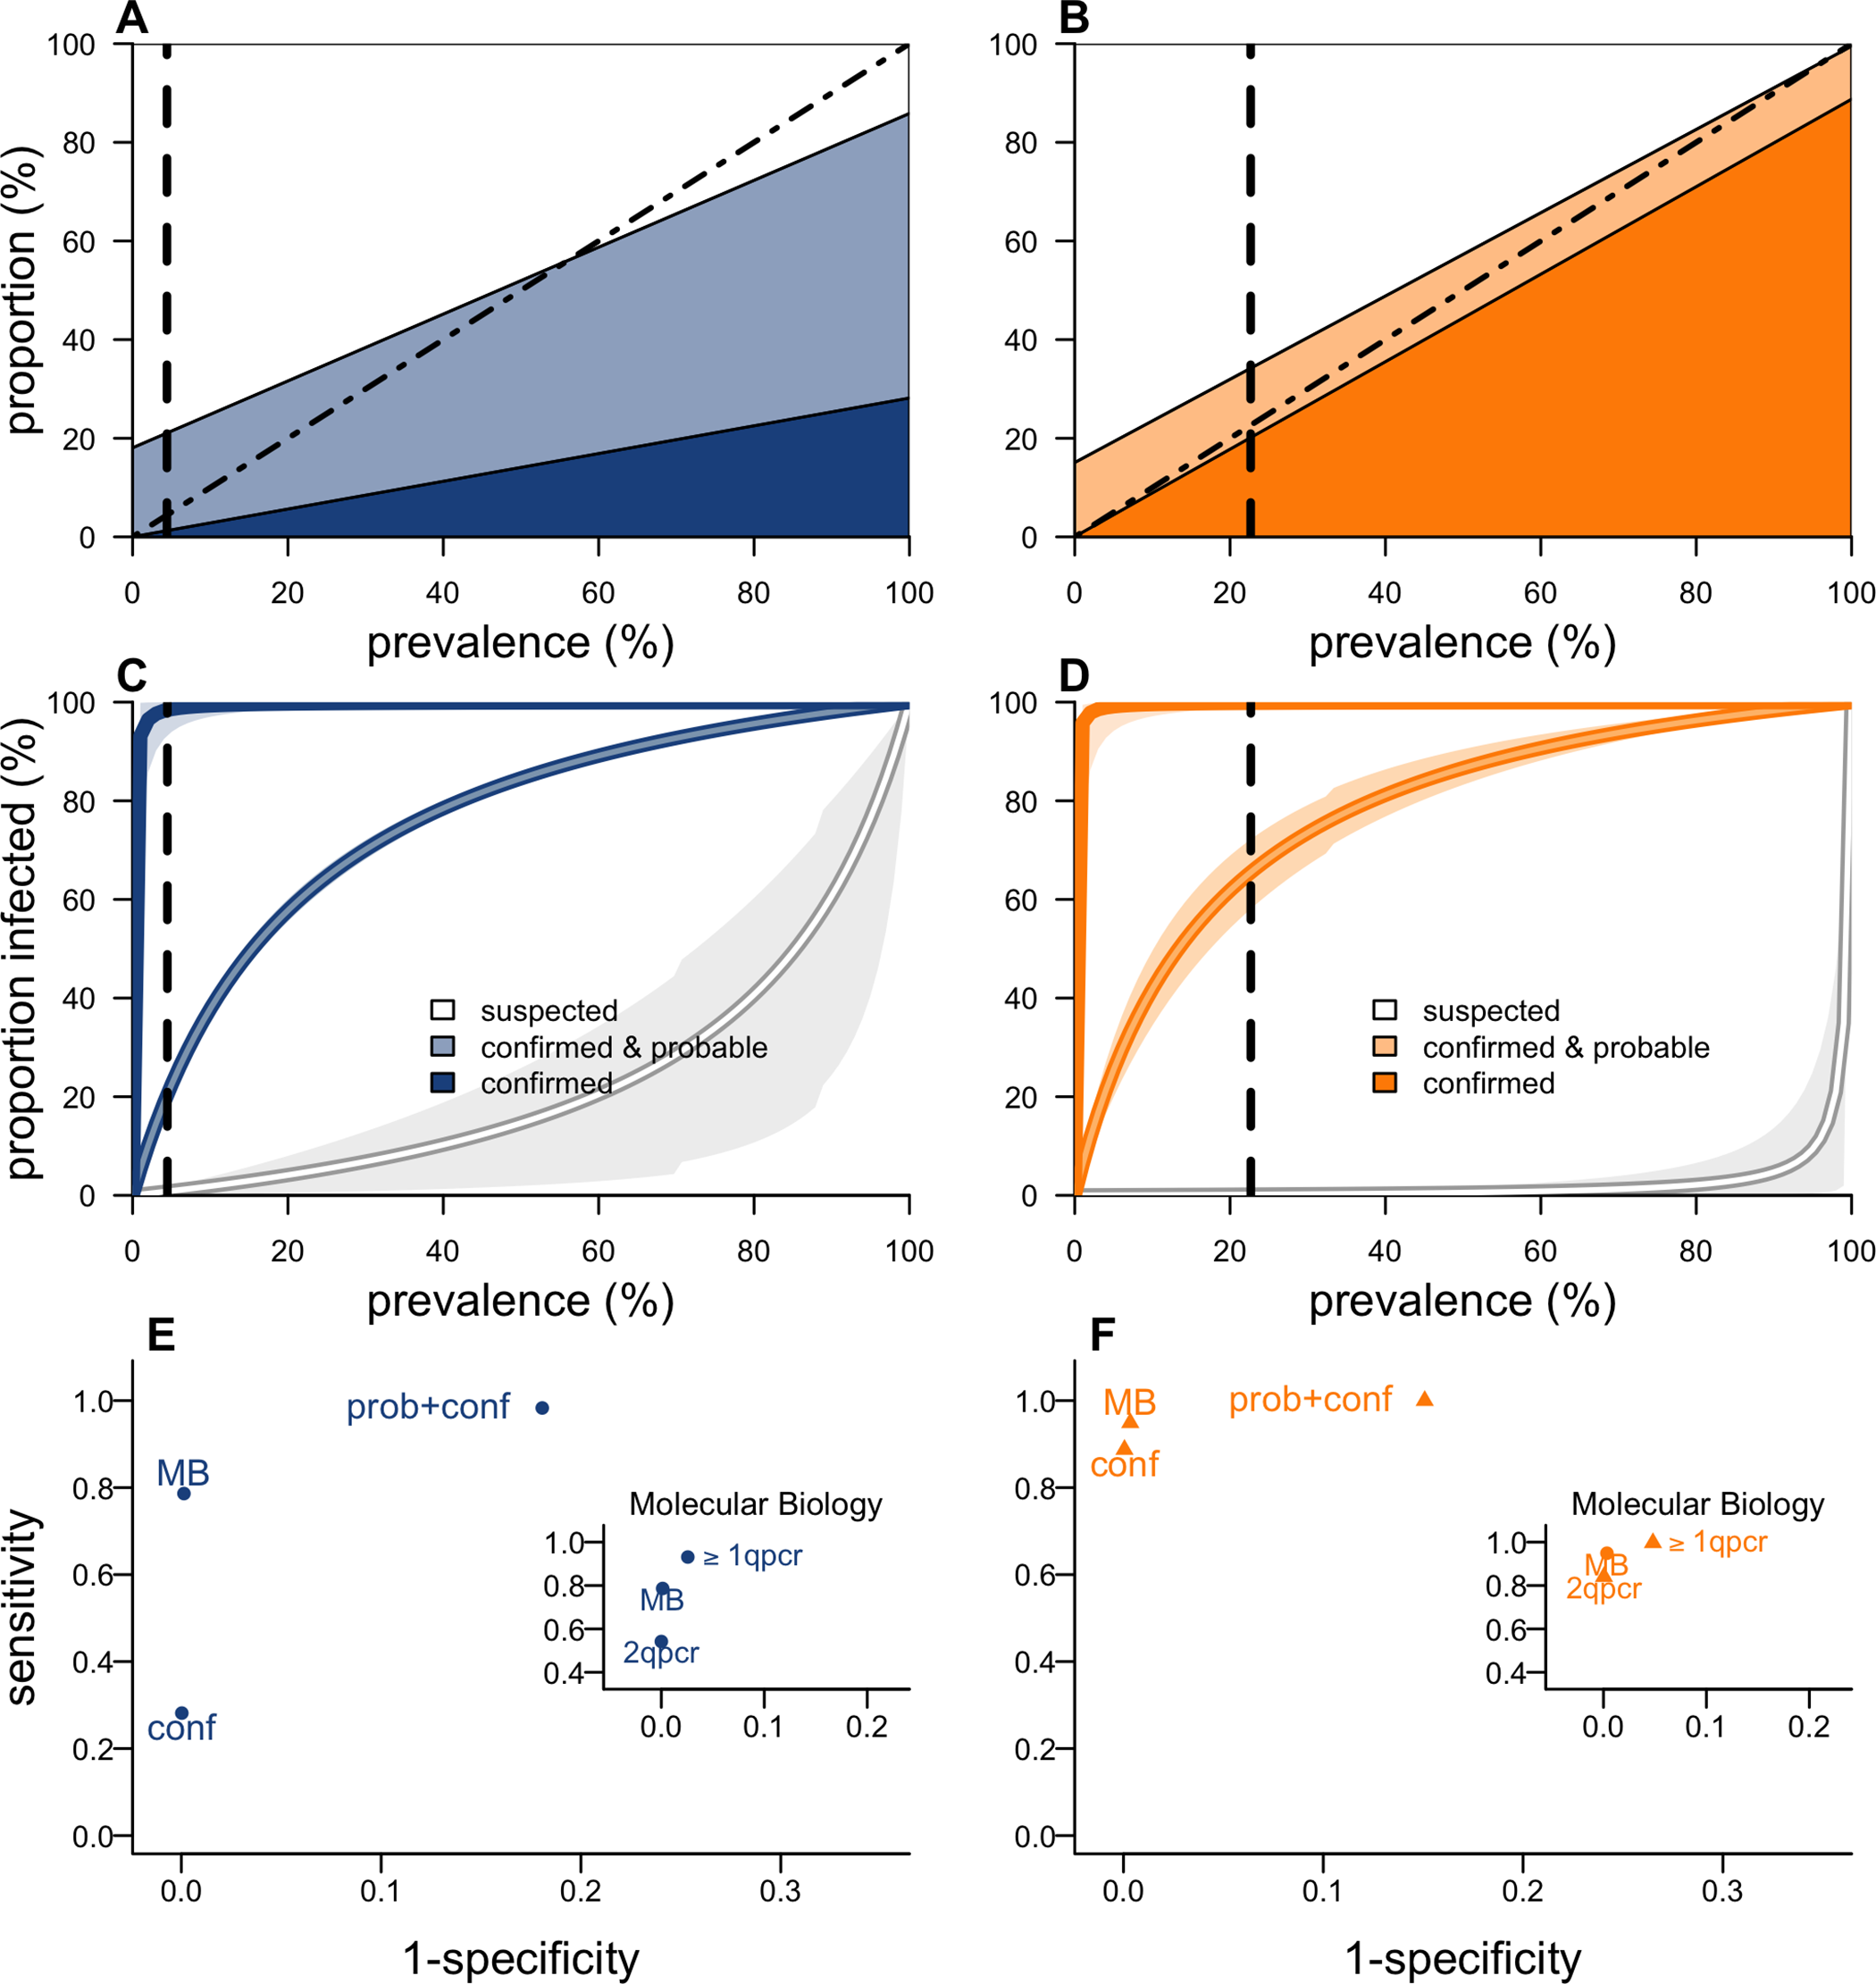
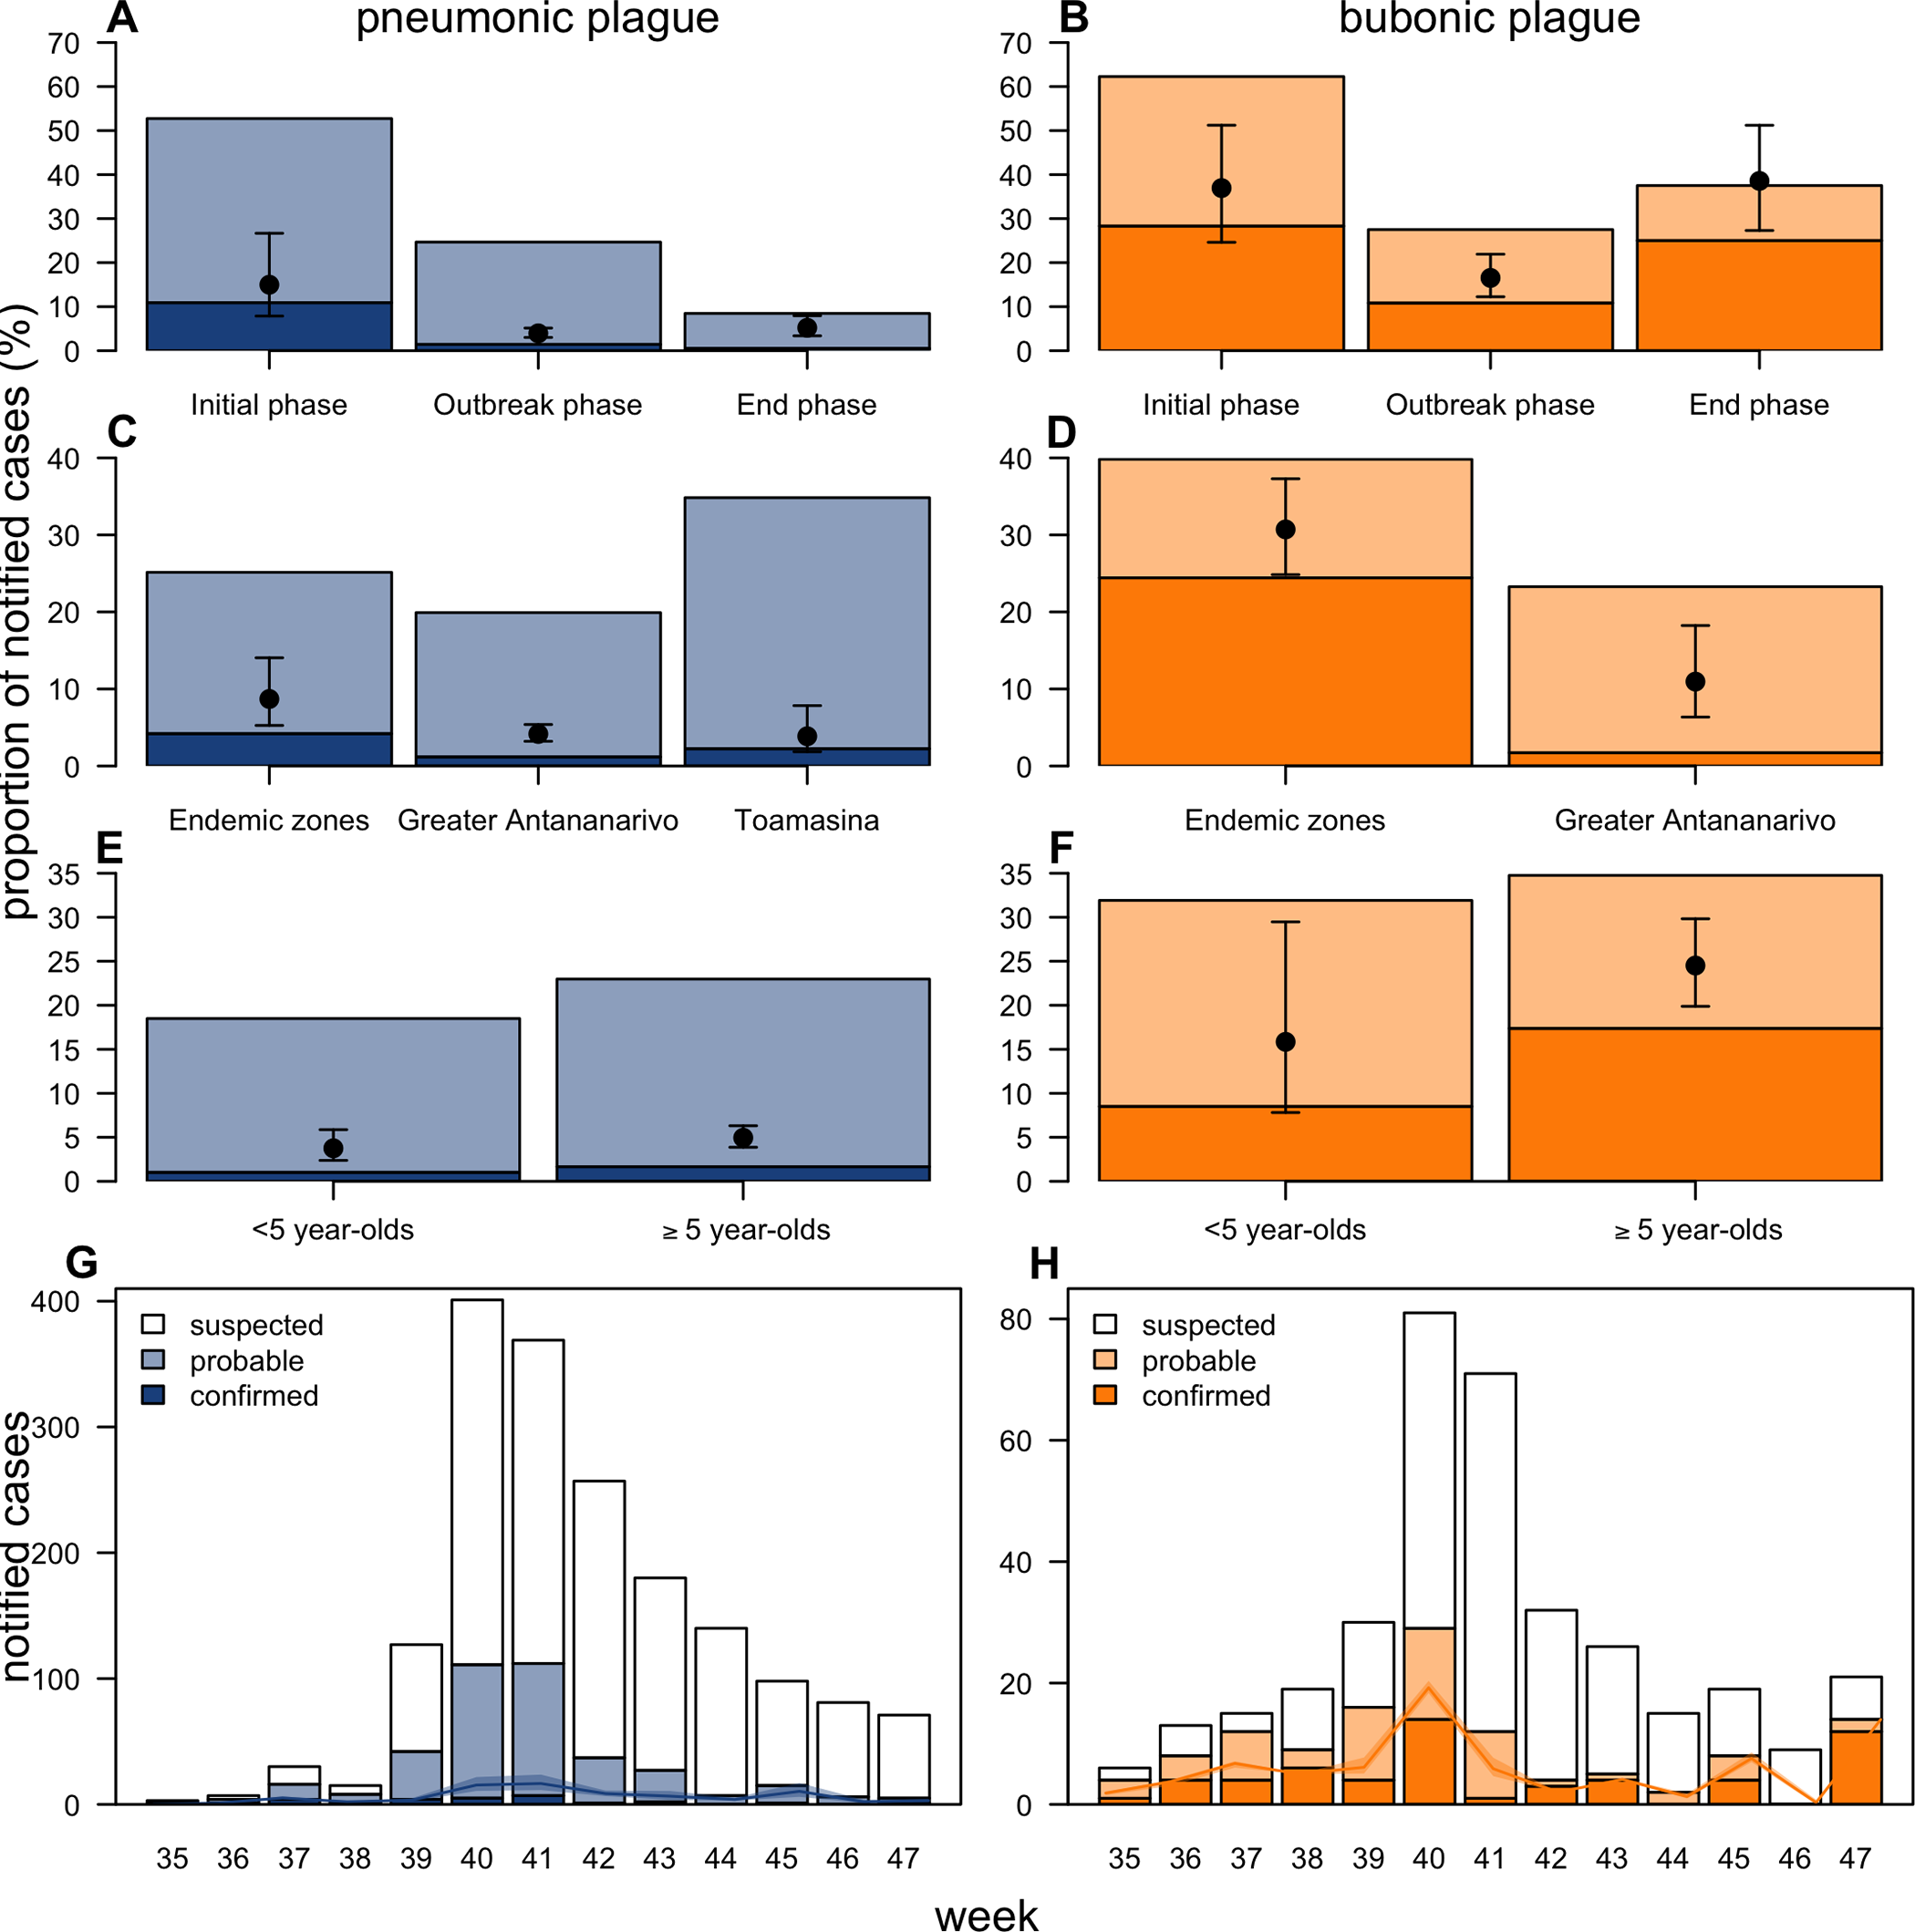
During outbreaks, the lack of diagnostic “gold standard” can mask the true burden of infection in the population and hamper the allocation of resources required for control. Here, we present an analytical framework to evaluate and optimize the use of diagnostics when multiple yet imperfect diagnostic tests are available. We apply it to laboratory results of 2,136 samples, analyzed with 3 diagnostic tests (based on up to 7 diagnostic outcomes), collected during the 2017 pneumonic (PP) and bubonic plague (BP) outbreak in Madagascar, which was unprecedented both in the number of notified cases, clinical presentation, and spatial distribution. The extent of these outbreaks has however remained unclear due to nonoptimal assays. Using latent class methods, we estimate that 7% to 15% of notified cases were Yersinia pestis-infected. Overreporting was highest during the peak of the outbreak and lowest in the rural settings endemic to Y. pestis. Molecular biology methods offered the best compromise between sensitivity and specificity. The specificity of the rapid diagnostic test was relatively low (PP: 82%, BP: 85%), particularly for use in contexts with large quantities of misclassified cases. Comparison with data from a subsequent seasonal Y. pestis outbreak in 2018 reveal better test performance (BP: specificity 99%, sensitivity: 91%), indicating that factors related to the response to a large, explosive outbreak may well have affected test performance. We used our framework to optimize the case classification and derive consolidated epidemic trends. Our approach may help reduce uncertainties in other outbreaks where diagnostics are imperfect.
Citation: ten Bosch Q, Andrianaivoarimanana V, Ramasindrazana B, Mikaty G, Rakotonanahary RJL, Nikolay B, et al. (2022) Analytical framework to evaluate and optimize the use of imperfect diagnostics to inform outbreak response: Application to the 2017 plague epidemic in Madagascar. PLoS Biol 20(8): e3001736. https://doi.org/10.1371/journal.pbio.3001736
Academic Editor: James Lloyd-Smith, University of California, Los Angeles, UNITED STATES
Received: November 15, 2021; Accepted: June 30, 2022; Published: August 15, 2022
Copyright: © 2022 ten Bosch et al. This is an open access article distributed under the terms of the Creative Commons Attribution License, which permits unrestricted use, distribution, and reproduction in any medium, provided the original author and source are credited.
Data Availability: Data and code required to reproduce the analysis in this manuscript are available on Open Science Framework: https://osf.io/nbc4t/.
Funding: This work was supported by Wellcome Trust/ Department of International Development (Grant 211309/Z/18/Z; https://wellcome.org/ supporting MM, RR, and FMR), AXA Research Fund (https://www.axa-research.org/ supporting QTB, BN, JP and SC), and the Laboratoire d’Excellence Integrative Biology of Emerging Infectious Diseases program (Grant ANR-10-LABX-62-IBEID; https://anr.fr/ supporting JPC, QTB, BN, JP and SC). The funders had no role in study design, data collection and analysis, decision to publish, or preparation of the manuscript.
Competing interests: The authors have declared that no competing interests exist.
Abbreviations:: BP, bubonic plague; CFR, case fatality ratio; CLP, central laboratory for plague; cPCR, classical polymerase chain reaction; IPM, Institut Pasteur de Madagascar; MB, molecular biology; MCMC, Markov chain Monte Carlo; PP, pneumonic plague; PPV, positive predictive value; qPCR, quantitative polymerase chain reaction; RDT, rapid diagnostic test.
Bron: PLOS BIOLOGY
Datum: August 15th 2022